Shopify Revenue vs Profit: Why Your Sales Number Can Mislead You
 Brian @brian
·
·
12 min read
3 views
Brian @brian
·
·
12 min read
3 views
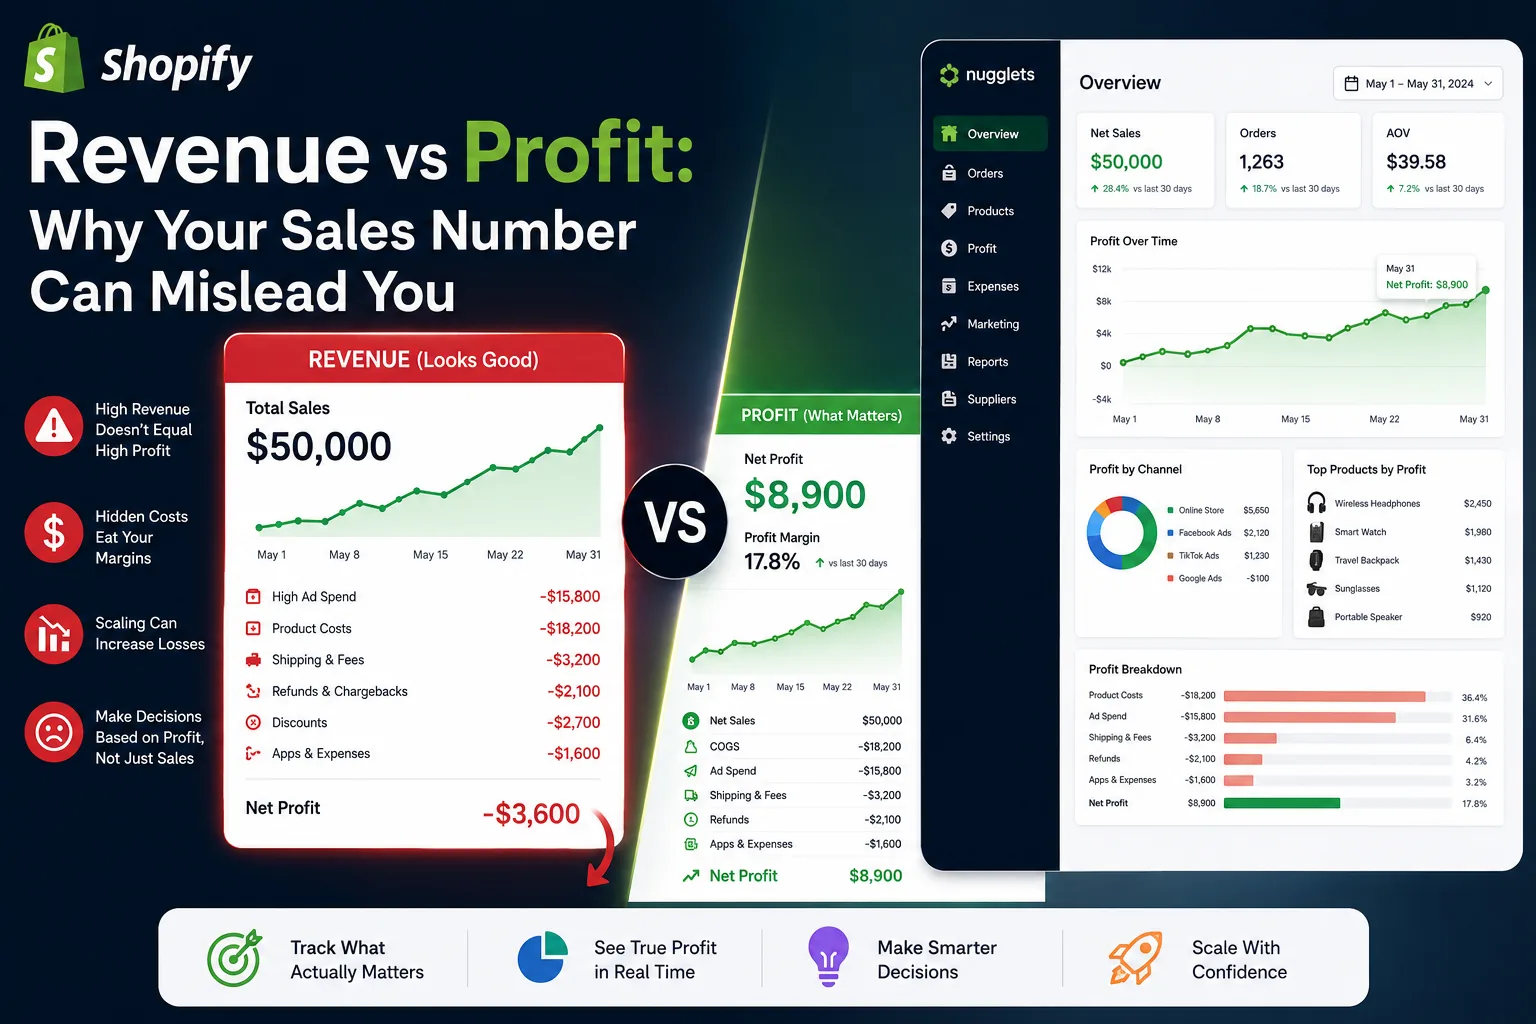
A spike in Shopify sales feels like a win.
More orders come in. Revenue climbs. Your Shopify dashboard looks healthy. It is easy to assume the store is becoming more profitable.
But sales do not tell the whole story.
A store can generate $50,000 in revenue and still have weak profit margins. In some cases, it can even lose money while the sales chart continues to rise.
That is why successful merchants do not rely on revenue alone. They use a Shopify profit tracker to understand what remains after product costs, ad spend, shipping, transaction fees, refunds, discounts, and operating expenses.
Shopify’s analytics and reporting tools provide valuable sales, finance, marketing, and product data. However, a store owner still needs to connect those figures to real costs before revenue can become a reliable measure of business performance. (Shopify Help Center)
This guide explains the difference between Shopify revenue and profit, why sales numbers can mislead you, and how to build a clearer system for tracking what your store actually earns.
Revenue Is the Money Your Store Generates
Revenue is the amount your business brings in from sales before many operating costs are deducted.
In Shopify, your sales reporting can include figures such as gross sales, discounts, returns, net sales, shipping charges, taxes, and other charges. Shopify notes that total sales can be calculated as net sales plus additional fees, duties, shipping charges, and taxes. (Shopify Help Center)
That makes revenue useful for measuring demand, growth, conversion performance, and sales volume.
But it does not show how much money your store keeps.
For example, a store might report:
| Metric | Amount |
|---|---|
| Total sales | $20,000 |
| Discounts | -$2,000 |
| Refunds and returns | -$1,000 |
| Net sales | $17,000 |
At first glance, $17,000 in net sales may look strong.
But this number still does not include the cost to acquire, fulfill, support, and deliver those orders.
Image to find: Shopify Analytics overview dashboard showing total sales, orders, and sales trends.
Alt text: “Shopify analytics dashboard showing total sales and order performance.”
Profit Is What Is Left After Your Costs
Profit is the money remaining after you subtract the expenses required to run your store.
A simple profit formula looks like this:
Net Profit =
Net Sales
- Cost of Goods Sold
- Shipping and Fulfillment
- Payment Fees
- Advertising Spend
- Refunds and Chargebacks
- Apps and Operating Costs
A Shopify profit tracker gives you a clearer answer than revenue alone because it brings sales and costs together.
Imagine two stores that each generate $30,000 in sales.
| Expense | Store A | Store B |
|---|---|---|
| Net sales | $30,000 | $30,000 |
| Product costs | -$9,000 | -$15,000 |
| Ad spend | -$4,000 | -$10,000 |
| Shipping and fulfillment | -$2,500 | -$3,500 |
| Transaction fees | -$900 | -$900 |
| Refunds | -$600 | -$1,200 |
| Net profit | $13,000 | -$600 |
Both businesses have the same sales number.
Only one is truly profitable.
This is why revenue is a vanity metric when viewed alone. It can make a struggling store look successful while hiding the expenses that matter most.
Image to find: Ecommerce profit waterfall chart showing revenue reduced by COGS, ad spend, shipping, fees, and refunds.
Alt text: “Ecommerce profit waterfall chart showing how Shopify revenue becomes net profit.”
Why Shopify Sales Numbers Can Mislead You
Your Shopify sales figure is not wrong. It is simply incomplete.
Sales reports are designed to help you understand revenue activity, but they do not automatically reveal every cost behind that revenue. Shopify also separates sales, payments, refunds, and finance data across different reports, which means merchants need to understand what each number includes before drawing conclusions. (Shopify Help Center)
Here are the most common reasons sales can look better than profit.
Product Costs Are Missing
Every order has a product cost.
For a standard ecommerce store, this could include manufacturing, wholesale inventory, packaging, and warehouse fees. For a dropshipping business, it usually includes supplier product costs, fulfillment charges, and supplier shipping fees.
Shopify allows merchants to enter a cost per item for products and variants, which helps support cost-of-goods and profit reporting. Shopify also notes that updating product costs consistently improves the value of profit reports. (Shopify Help Center)
If your product costs are outdated, your profit reporting will be misleading.
A product that cost $8 to source last month may cost $11 today. That small change can dramatically affect profit, especially when you sell at low margins.
Advertising Spend Is Not Revenue
Ad spend is one of the largest blind spots for ecommerce brands.
A Facebook, Instagram, TikTok, Google, or influencer campaign can generate many orders while still failing to create profit. A campaign might produce a respectable return on ad spend while leaving little room for COGS, shipping, payment fees, and returns.
Shopify’s marketing performance reporting can include sales, orders, average order value, cost, ROAS, CPA, conversion rate, clicks, and impressions. Those metrics are useful, but they still need to be evaluated alongside your actual margins. (Shopify Help Center)
A $10,000 campaign that brings in $30,000 in revenue may look impressive with a 3x ROAS. But if your products, fulfillment, and fees cost $18,000, your remaining profit may be much lower than expected.
Shipping Costs Can Quietly Eat Margin
Customers may pay for shipping, but that does not guarantee your business makes money on shipping.
A store may charge a customer $4.99 for delivery while paying a supplier or carrier $7.50 to fulfill the order. The difference becomes a hidden cost.
This matters even more for international dropshipping, bulky products, expedited orders, and products with inconsistent supplier fulfillment rates.
Your dropshipping profit tracker should show:
-
Shipping revenue collected
-
Supplier shipping charges
-
Fulfillment fees
-
Return shipping costs
-
Replacement order costs
-
Shipping costs by country or sales channel
Without this level of visibility, an apparently profitable product can become a loss maker when shipping prices rise.
Image to find: Ecommerce package fulfillment scene or shipping-cost dashboard visual.
Alt text: “Ecommerce shipping and fulfillment costs affecting Shopify profit margins.”
Discounts Reduce Your Margin
Discounts can lift conversion rates, raise average order value, or help clear inventory.
But they also reduce the amount available to cover your costs.
A 20% discount may seem manageable until you calculate the effect on a product with a narrow margin.
For example:
| Metric | Before Discount | After 20% Discount |
|---|---|---|
| Product selling price | $50 | $40 |
| Product cost | $20 | $20 |
| Ad spend per order | $10 | $10 |
| Fees and shipping | $7 | $7 |
| Net profit | $13 | $3 |
The product is still selling. Revenue may still be growing. But the profit per sale has dropped by more than 75%.
This is why a Shopify sales tracker should always be paired with a profit view that accounts for discounts.
Refunds Are More Expensive Than They Look
A refund does not only reduce revenue.
In many cases, you have already paid for:
-
The product
-
Supplier fulfillment
-
Outbound shipping
-
Advertising
-
Payment processing
-
Customer support
-
Return shipping or replacement products
Shopify distinguishes returns in sales reporting from refunds in payments reporting, which is another reason merchants should look beyond one sales number. (Shopify Help Center)
A product with high refund rates may appear to be a bestseller while quietly weakening your store’s profitability.
Track refund rates by:
-
Product
-
Variant
-
Supplier
-
Country
-
Ad campaign
-
Offer or discount code
-
Customer acquisition source
This can help you identify quality issues, misleading product descriptions, sizing problems, slow shipping routes, or ads that create unrealistic expectations.
Image to find: Refund and return analytics visual with product-level performance insights.
Alt text: “Shopify refund analytics showing product return rates and revenue impact.”
Revenue Can Increase While Profit Falls
One of the most dangerous ecommerce situations is growing sales while losing margin.
This often happens when merchants scale campaigns too quickly.
Here is an example:
| Metric | Month 1 | Month 2 |
|---|---|---|
| Revenue | $25,000 | $50,000 |
| Ad spend | $5,000 | $16,000 |
| Product costs | $8,000 | $18,000 |
| Shipping and fees | $4,000 | $8,000 |
| Refunds | $1,000 | $3,000 |
| Net profit | $7,000 | $5,000 |
Revenue doubled.
Profit fell.
The business may look like it is scaling, but the economics are getting worse.
This is why you need to track profit by product, channel, campaign, and supplier. A large increase in sales is only valuable when your profit keeps pace.
A real-time Shopify dashboard helps you notice this earlier, before you spend more budget on products or campaigns that are becoming less efficient.
Image to find: Side-by-side chart showing sales rising while profit declines.
Alt text: “Chart showing Shopify revenue increasing while net profit decreases.”
The Metrics Every Shopify Profit Tracker Should Include
A useful Shopify profit tracker should help you monitor both daily performance and long-term trends.
At a minimum, your dashboard should include:
| Metric | Why It Matters |
|---|---|
| Gross sales | Measures total product demand before deductions |
| Net sales | Reflects sales after discounts and returns |
| COGS | Shows the direct product cost behind orders |
| Ad spend | Reveals acquisition cost |
| Shipping cost | Identifies fulfillment pressure on margins |
| Payment fees | Captures transaction-related expenses |
| Refund amount | Highlights revenue and margin leakage |
| Net profit | Shows what your business actually earns |
| Profit margin | Makes performance comparable across products |
| CPA | Shows the cost to acquire an order or customer |
| ROAS | Measures revenue generated per ad dollar |
| Contribution margin | Shows profitability before fixed overhead |
Shopify finance reports provide an overview of sales, payments, gift cards, tips, and gross profit for a selected period. Shopify also offers profit-margin reports and finance reporting that can help store owners investigate those components in more detail. (Shopify Help Center)
The key is to avoid treating any one metric as the entire story.
For example:
-
High ROAS does not always mean high profit.
-
High revenue does not always mean healthy cash flow.
-
High average order value does not always mean strong margins.
-
High sales volume does not always mean a product deserves more ad spend.
How to Calculate Shopify Profit More Accurately
Use this process to create a more reliable profit view.
1. Start With Net Sales
Begin with net sales instead of gross sales.
Shopify defines net sales as sales revenue with discounts and sales reversals factored in. (Shopify Help Center)
This is a better foundation because it removes some of the revenue that was never truly retained.
2. Subtract Product and Supplier Costs
Add accurate product costs for every active product and variant.
For dropshipping, review supplier prices weekly or whenever you add a new product. Include product cost, handling fees, fulfillment charges, and supplier shipping.
3. Subtract Ad Spend
Import or record spending from every acquisition channel, including Meta Ads, TikTok Ads, Google Ads, influencer campaigns, and affiliate commissions.
Do not rely only on the revenue reported by the ad platform. Compare channel data with your Shopify sales, product costs, and refunds.
4. Subtract Transaction Fees and Shipping Costs
Payment fees and fulfillment costs are easy to overlook because they may be smaller than ad spend or product costs.
But at scale, they can represent a major part of your total expenses.
5. Account for Refunds and Chargebacks
Treat refunds as a profitability issue, not only a customer-service metric.
Include the lost revenue and any costs you cannot recover, such as product costs, paid shipping, processing fees, and customer support time.
6. Include Fixed Operating Costs
Finally, add recurring business costs:
-
Shopify plan fees
-
Apps and subscriptions
-
Creative tools
-
Contractor or agency fees
-
Customer service software
-
Accounting tools
-
Warehousing or storage fees
This gives you a clearer view of net profit rather than only product-level contribution margin.
Image to find: Shopify profit tracking checklist or dashboard graphic showing connected cost categories.
Alt text: “Shopify profit tracker checklist including sales, COGS, ads, shipping, fees, and refunds.”
Product-Level Profitability Is More Useful Than Store-Wide Averages
Store-wide profit is important, but averages can hide problems.
A business may be profitable overall because one product generates excellent margins while several other products lose money.
That is why your ecommerce profit tracker should break performance down by:
-
Product
-
Variant
-
Supplier
-
Collection
-
Sales channel
-
Campaign
-
Country
-
Discount code
-
Customer segment
Shopify’s reports can support product-performance and profit-margin analysis, while product cost data helps merchants understand COGS and margins. (Shopify Help Center)
For example, a product could have:
-
High revenue
-
Strong conversion rate
-
Good ROAS
-
High refund rate
-
Low repeat purchase rate
-
Weak net profit
Without product-level data, you may keep scaling it because it looks like a winner.
With a Shopify profit tracker, you can see whether it is truly worth growing.
A Shopify Dashboard Should Help You Make Decisions Faster
A good Shopify dashboard is not just a reporting tool. It should help you take action.
Your daily view should answer:
-
Did we make a profit today?
-
Which products made the most profit?
-
Which campaigns consumed too much budget?
-
Are refunds increasing?
-
Has a supplier cost changed?
-
Which orders have unusually low margins?
-
Are shipping costs higher than normal?
-
Is a store or channel becoming less profitable?
Shopify’s analytics environment includes dashboards and reports for store activity, transaction analysis, visitor behavior, and web performance. Merchants can also use reports and customizable visualizations to investigate specific performance questions. (Shopify Help Center)
The best dashboard makes important information easy to see without manually combining spreadsheets every morning.
For a growing business, this can include:
-
A Shopify sales tracker for revenue trends
-
A Shopify profit tracker for margin visibility
-
A Shopify order management dashboard for fulfillment status
-
A Shopify competitor tracker for pricing changes
-
A multi-store dashboard for comparing multiple brands or regions
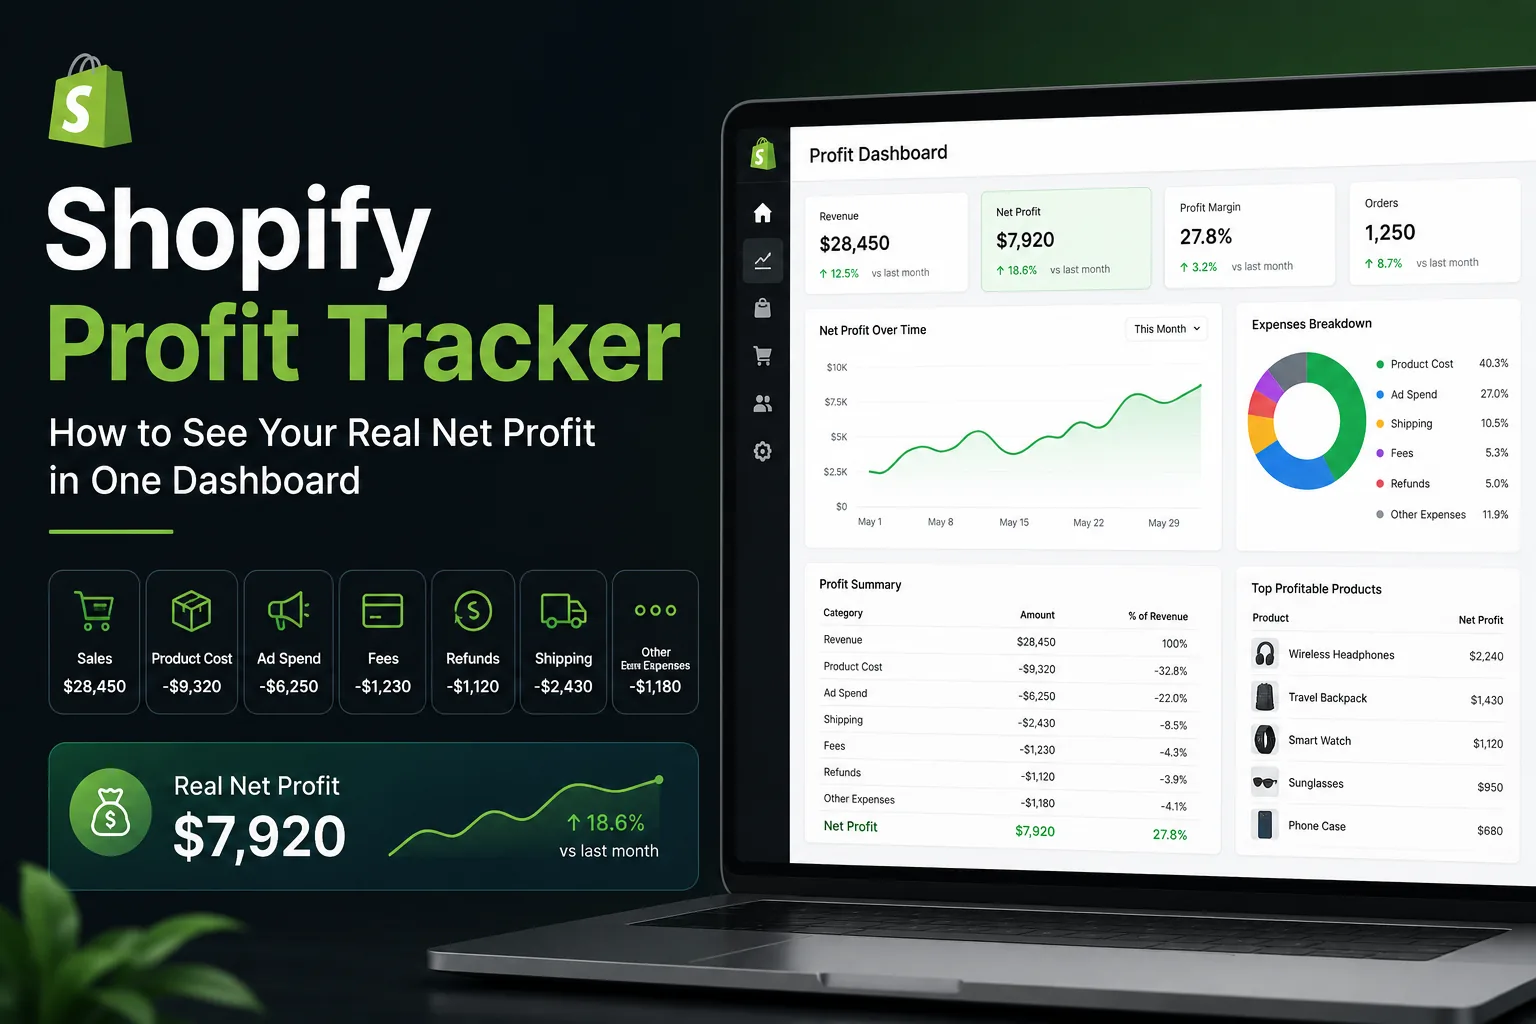
How Nugglets Helps Merchants Look Beyond Revenue
Nugglets is built for store owners who need more than sales numbers.
A sales dashboard can tell you how much you sold. A Shopify profit tracker helps you understand what you made after the costs that determine real business health.
For ecommerce and dropshipping teams, the most valuable view combines:
-
Revenue and net sales
-
Product and supplier costs
-
Ad spend
-
Shipping and fulfillment
-
Fees
-
Refunds
-
Product-level margins
-
Order-level performance
-
Multi-store reporting
-
Competitor and supplier insights
That gives you a clearer path to scaling. Instead of increasing spend because revenue looks good, you can increase spend because profit supports it.
Image to find: Modern Shopify profit tracker dashboard showing product profit, sales, ad spend, and expenses.
Alt text: “Shopify profit tracker dashboard for monitoring sales, advertising costs, expenses, and net profit.”
Final Thoughts: Revenue Gets Attention, Profit Builds a Business
Revenue is exciting because it is visible.
Profit is more important because it determines whether your Shopify store can survive, reinvest, and scale.
Your sales number can mislead you when it excludes:
-
Product costs
-
Supplier price changes
-
Ad spend
-
Shipping costs
-
Transaction fees
-
Discounts
-
Refunds
-
Chargebacks
-
Apps and operating costs
The solution is not to stop tracking revenue. It is to put revenue in context.
Use a Shopify profit tracker to connect sales to the costs behind those sales. When you can see true profit by product, channel, supplier, and campaign, you make smarter decisions about what to scale, what to fix, and what to stop selling.
Run your whole store from one dashboard
Track orders, suppliers, inventory and real profit with Nugglets.
See NuggletsKeep reading
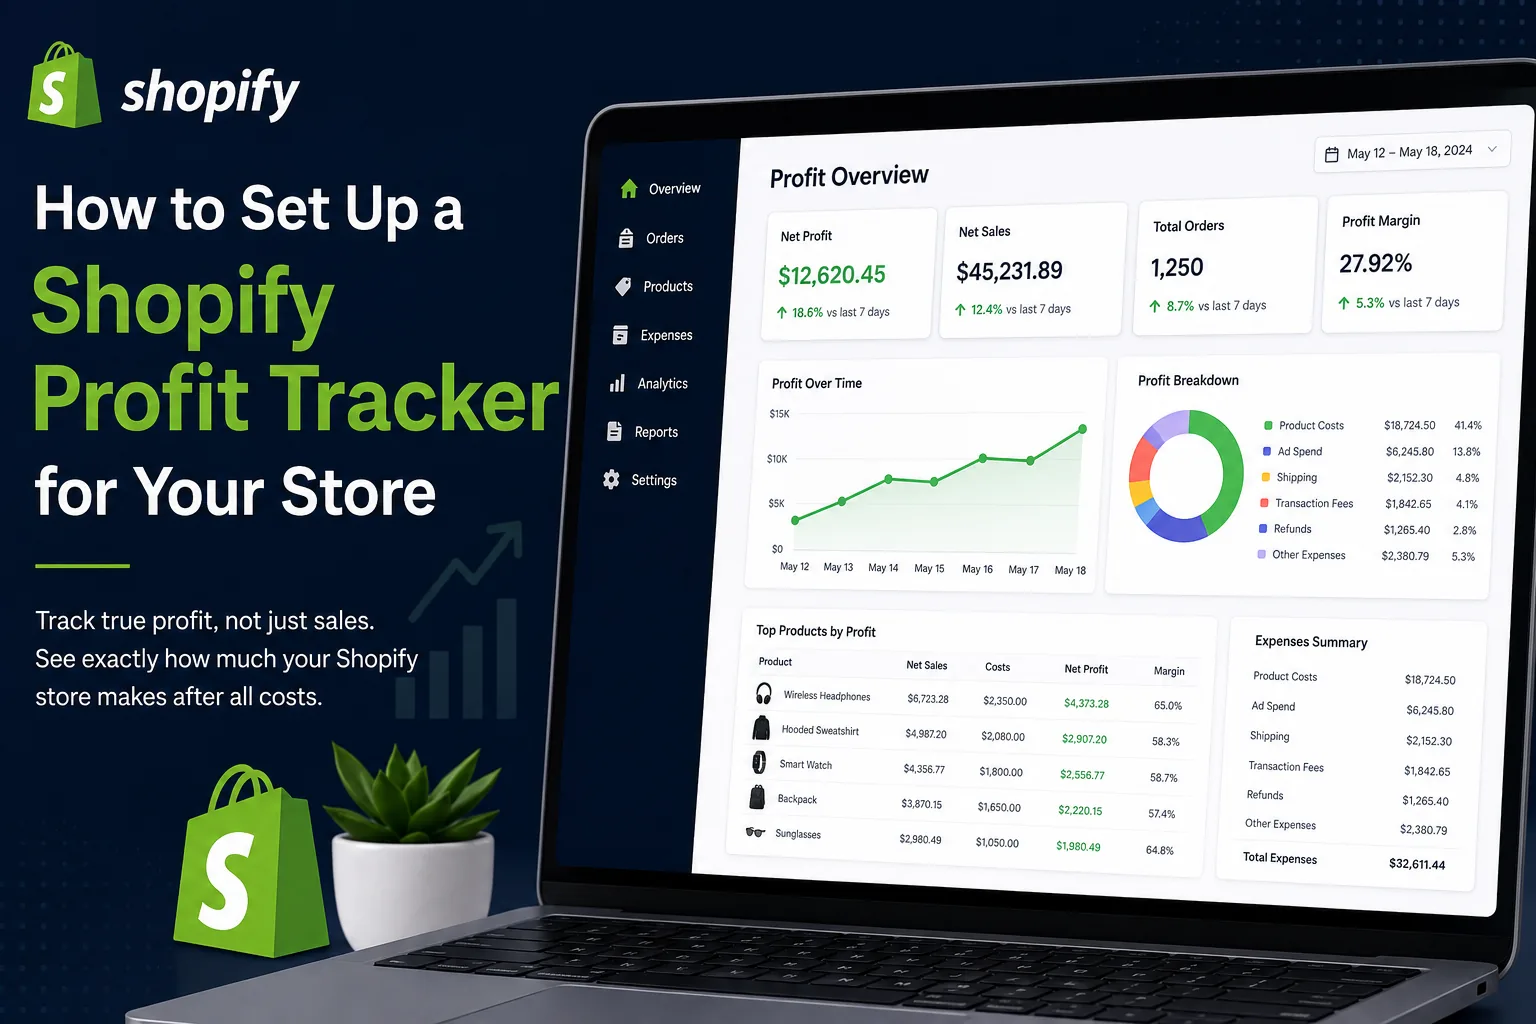
How to Set Up a Shopify Profit Tracker for Your Store

Comments 0