How to Set Up a Shopify Profit Tracker for Your Store
 Brian @brian
·
·
12 min read
4 views
Brian @brian
·
·
12 min read
4 views
A Shopify store can generate thousands of dollars in sales while delivering little, or even negative, profit. Product costs, transaction fees, shipping, discounts, refunds, ad spend, subscriptions, and supplier changes all affect what you actually keep.
That is why every serious merchant needs a reliable Shopify profit tracker.
A profit tracker turns scattered store data into a clear answer to one important question: How much money did my store really make today?
Shopify Analytics already provides dashboards and reports for reviewing store activity, transactions, traffic, and sales performance. However, a complete ecommerce profit view requires you to account for costs beyond revenue alone. (Shopify Help Center)
This guide explains how to build a Shopify profit tracking system that helps you monitor daily performance, spot unprofitable products, make smarter ad decisions, and scale with confidence.
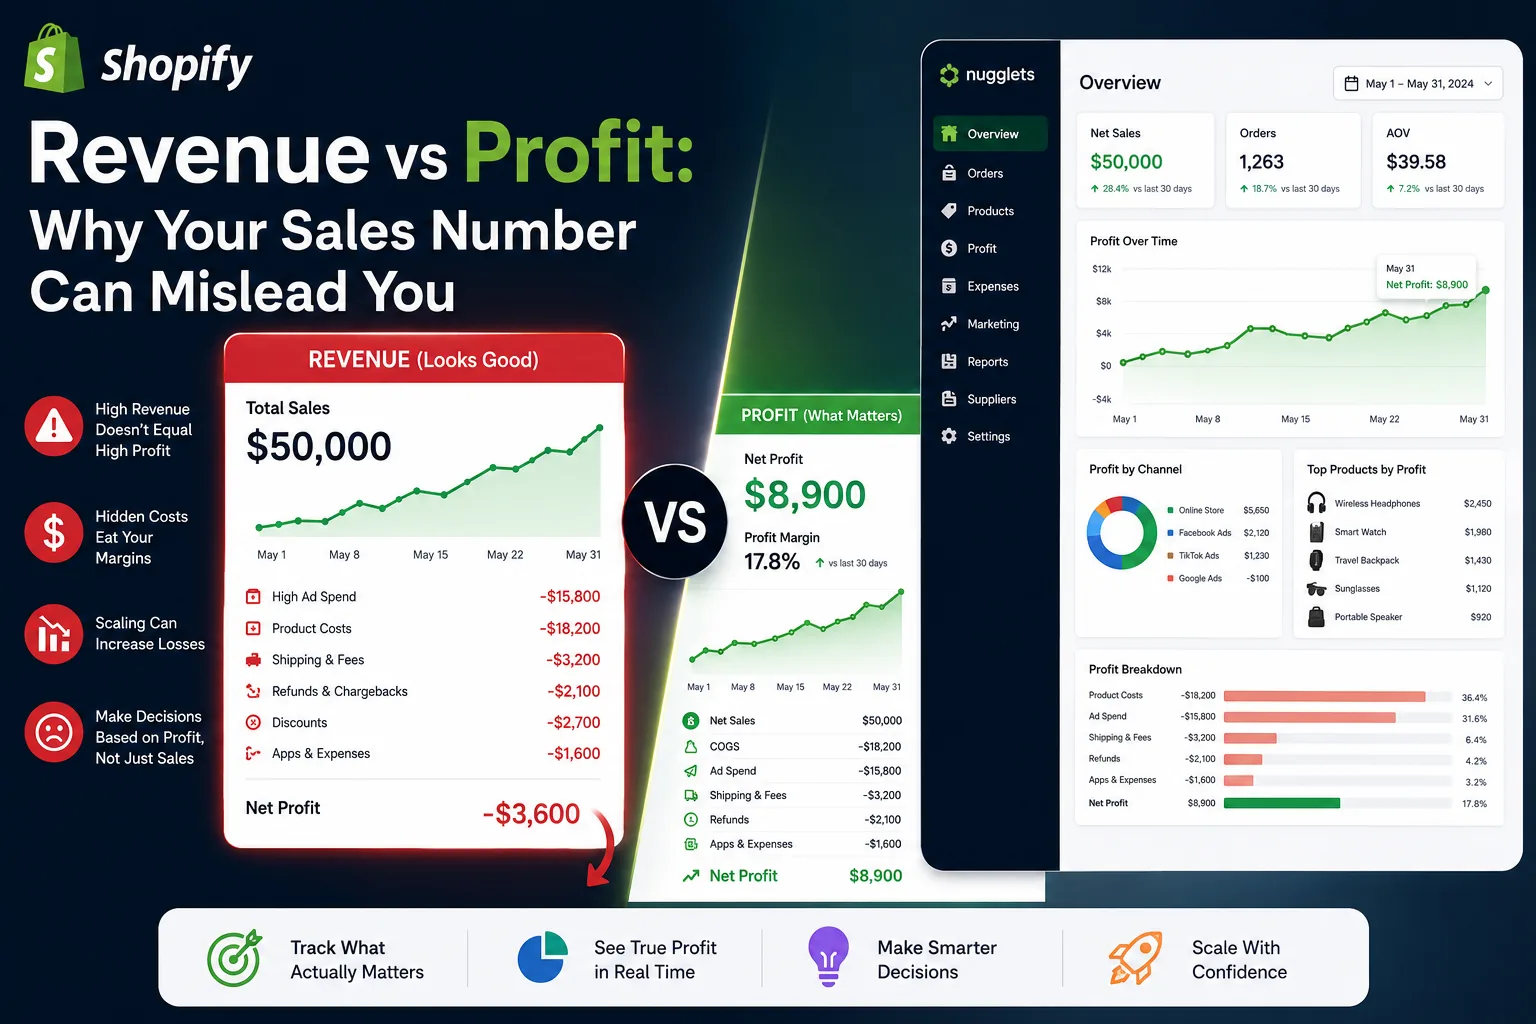
Why Shopify Sales Are Not the Same as Shopify Profit
A store owner might see $10,000 in sales and assume the business is performing well. But sales are only the starting point.
Your true profit depends on the money left after expenses:
Net Profit =
Net Sales
- Product Costs
- Supplier and Fulfillment Costs
- Shipping Costs
- Transaction Fees
- Ad Spend
- Refunds and Chargebacks
- App and Operating Costs
For a dropshipping store, the gap between revenue and profit can be especially large. A product may appear profitable until shipping prices increase, a supplier changes its price, or an ad campaign becomes more expensive.
Shopify’s finance reporting separates important figures such as sales, discounts, returns, taxes, payments, and gross profit. Its total-sales calculations can include shipping, taxes, returns, and fees, so merchants should avoid treating the top-line sales figure as net profit. (Shopify Help Center)
Visual direction: Use a licensed screenshot of a Shopify Analytics or finance dashboard showing total sales alongside profit-related metrics.
Alt text: “Shopify dashboard showing sales, costs, and ecommerce profit metrics.”
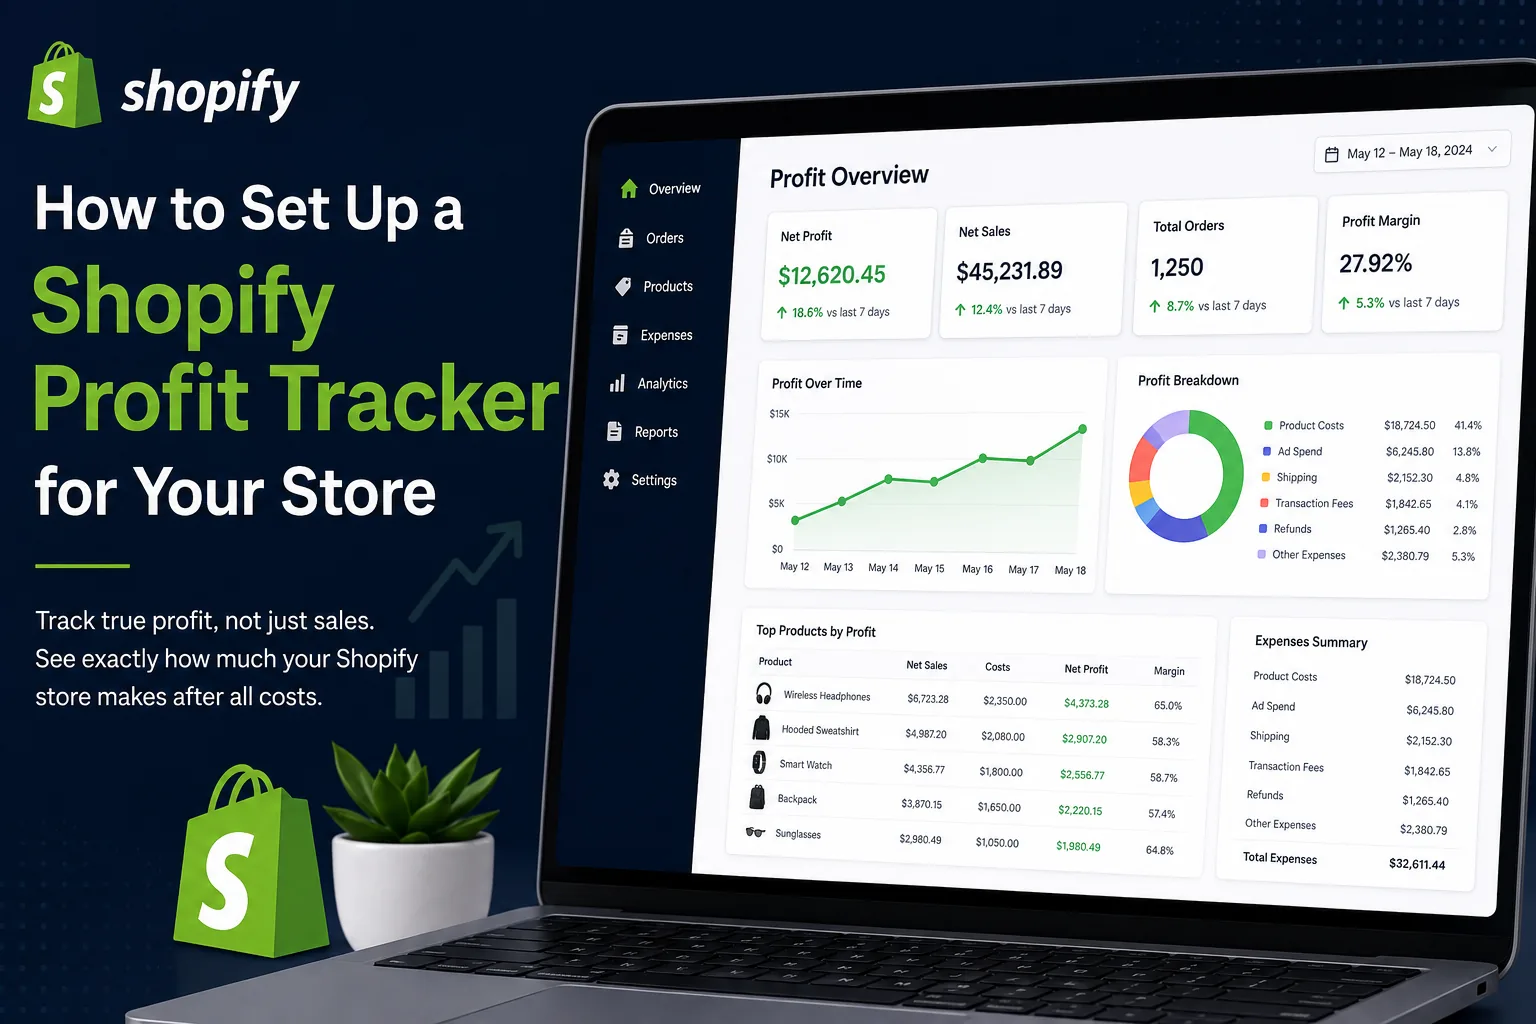
What a Shopify Profit Tracker Should Track
A useful Shopify profit tracker should not only show daily revenue. It should bring together the expenses and metrics that influence your margins.
At a minimum, track:
-
Net sales after discounts and refunds
-
Cost of goods sold, or COGS
-
Supplier costs by product and variant
-
Shipping and fulfillment expenses
-
Payment processing fees
-
Advertising spend by channel and campaign
-
Refunds, returns, and chargebacks
-
App subscriptions and recurring operating costs
-
Profit by product, order, collection, channel, and store
For growing brands, a stronger Shopify dashboard may also include inventory performance, supplier information, order status, competitor pricing, and multi-store reporting.
The goal is not to create more reports. The goal is to create one decision-making view that tells you what to keep, pause, improve, or scale.
Step 1: Choose Your Shopify Profit Tracking Setup
There are three common ways to set up profit tracking.
Option 1: Shopify reports and spreadsheets
This approach works for early-stage stores with a limited number of orders and products.
You can export Shopify sales and finance reports, then combine them with ad spend, supplier invoices, and shipping costs in a spreadsheet.
Shopify’s reports are organized by areas such as sales, acquisition, inventory, and finances. You can also customize reports and export larger data sets when needed. (Shopify Help Center)
The downside is maintenance. Every new product, supplier price change, refund, or ad campaign can create more manual work.
Option 2: A dedicated Shopify profit tracker
A dedicated ecommerce profit tracker is often a better fit once you begin spending on ads, managing multiple products, or processing a consistent order volume.
The right tool should reduce manual inputs by connecting your sales, product costs, fees, and marketing spend in one view. This gives you faster visibility into daily profit and helps prevent decisions based on revenue alone.
For Nugglets, position the product as a Shopify profit tracker built for merchants who want a clear dashboard for sales, costs, orders, suppliers, and growth decisions.
Option 3: A multi-store ecommerce dashboard
If you run multiple Shopify stores, brands, or regional storefronts, use a multi-store dashboard that combines store-level data while still allowing you to drill down into individual product and channel performance.
This is particularly useful for agencies, dropshipping operators, and ecommerce teams that need to compare profitability across stores without switching between multiple accounts.
Visual direction: Show a simple comparison graphic: spreadsheet tracking versus an automated Shopify profit tracker dashboard.
Alt text: “Comparison between manual spreadsheets and an automated Shopify profit tracker.”
Step 2: Add Accurate Product Costs
Profit tracking starts with product costs.
In Shopify, you can add a cost per item for each product variant. Shopify uses this cost information to calculate gross profit in its profit reports. (Shopify Help Center)
Go through your product catalog and record the current cost for every active variant.
Include:
-
Supplier unit price
-
Product packaging costs
-
Fulfillment charges
-
Customs or duties where applicable
-
Product-specific shipping charges
-
Any required inspection or handling fees
Do not use one average cost for every product unless your catalog is extremely simple. A low-cost variant and a higher-cost variant can have very different margins, even if they share the same product name.
For dropshipping stores, review product costs regularly. Supplier pricing can change quickly, and one unnoticed increase can turn a winning product into a loss.
Shopify notes that the cost-per-item field is static, meaning reporting reflects the cost recorded at the relevant time. It also notes that discounts and refunds affect net sales and profit margins. (Shopify Help Center)
Visual direction: Use a product-editing screenshot that highlights a cost-per-item field, with sensitive store information removed.
Alt text: “Adding cost per item for a Shopify product variant.”
Step 3: Track Variable Costs Beyond COGS
COGS is important, but it is not the full picture.
A product that costs $12 to source and sells for $40 may seem highly profitable. That conclusion changes when you include $6 in ad spend, $3 in shipping, $1.50 in processing fees, and refund costs.
Create expense categories that reflect how your store actually operates:
-
Product and supplier costs
-
Shipping and fulfillment
-
Payment processor fees
-
Marketplace or platform fees
-
Advertising spend
-
Influencer and affiliate commissions
-
Creative production costs
-
Customer support costs
-
Apps and software subscriptions
-
Packaging, returns, and replacement orders
Separate variable costs from fixed costs. Variable costs rise as order volume rises. Fixed costs, such as a software subscription, may remain the same regardless of the number of orders.
This distinction makes your Shopify profit tracker more useful. It lets you calculate contribution margin, understand break-even points, and make better scaling decisions.
Visual direction: Use a clean expense-breakdown chart showing revenue, COGS, ad spend, fees, shipping, and net profit.
Alt text: “Ecommerce profit breakdown including product costs, ad spend, fees, and shipping.”
Step 4: Connect Advertising Spend to Store Revenue
A profitable Shopify store needs more than a sales tracker. It needs ad spend visibility.
When paid traffic is involved, you should know:
-
Which channels drive profitable orders
-
Which campaigns create high-cost sales
-
Which ad sets produce repeat customers
-
Which creatives generate revenue but weak margins
-
Which products can support additional spend
Shopify’s marketing performance tools can show sales, sessions, orders, conversion rate, average order value, ROAS, CPA, clicks, and other channel-level metrics. These reports rely on UTM parameters and connected marketing app activity. (Shopify Help Center)
Set a consistent UTM naming system for every paid campaign. For example:
utm_source=meta
utm_medium=paid-social
utm_campaign=summer-product-launch
utm_content=video-creative-a
A consistent structure makes your reporting easier to trust. It also helps your Shopify profit tracker connect ad spend with the products, offers, and campaigns that generated the orders.
Do not judge campaigns only by ROAS. A campaign can produce an attractive ROAS while still delivering weak profit if your product costs, refunds, or shipping expenses are high.
Visual direction: Use a campaign performance image showing sales, ad spend, CPA, ROAS, and estimated profit.
Alt text: “Shopify marketing dashboard comparing ad spend, ROAS, and profit.”
Step 5: Decide How You Will Treat Discounts, Refunds, and Fees
Discounts can increase conversion rates, but they reduce margin. Refunds can erase revenue after you have already paid for an ad click, product fulfillment, and shipping.
Your Shopify profit tracker should handle these rules consistently.
Discounts
Track discounts at the order and product level. This helps you see whether a promotion is creating profitable volume or merely lowering your margin.
Refunds
Refunded orders should reduce your revenue and profit reporting. Where possible, account for non-recoverable expenses such as outbound shipping, return shipping, payment fees, or replacement products.
Payment fees
Payment fees should be included in your profitability analysis, especially for low-margin products. Small fees become meaningful as order volume grows.
Shipping revenue versus shipping cost
Customers may pay for shipping, but that does not mean shipping is profitable. Compare the shipping amount collected against the actual fulfillment and carrier cost.
Shopify’s Finance Summary includes sales, payments, gift cards, and gross profit information, while its payments reports track transactions and refunds separately. Shopify also explains that payouts and payment reporting can differ from sales reporting because timing and payment capture can vary. (Shopify Help Center)
Visual direction: Use a before-and-after order example showing how a discount, refund, fee, and shipping cost change net profit.
Alt text: “Example Shopify order profit after discount, refund, payment fee, and shipping cost.”
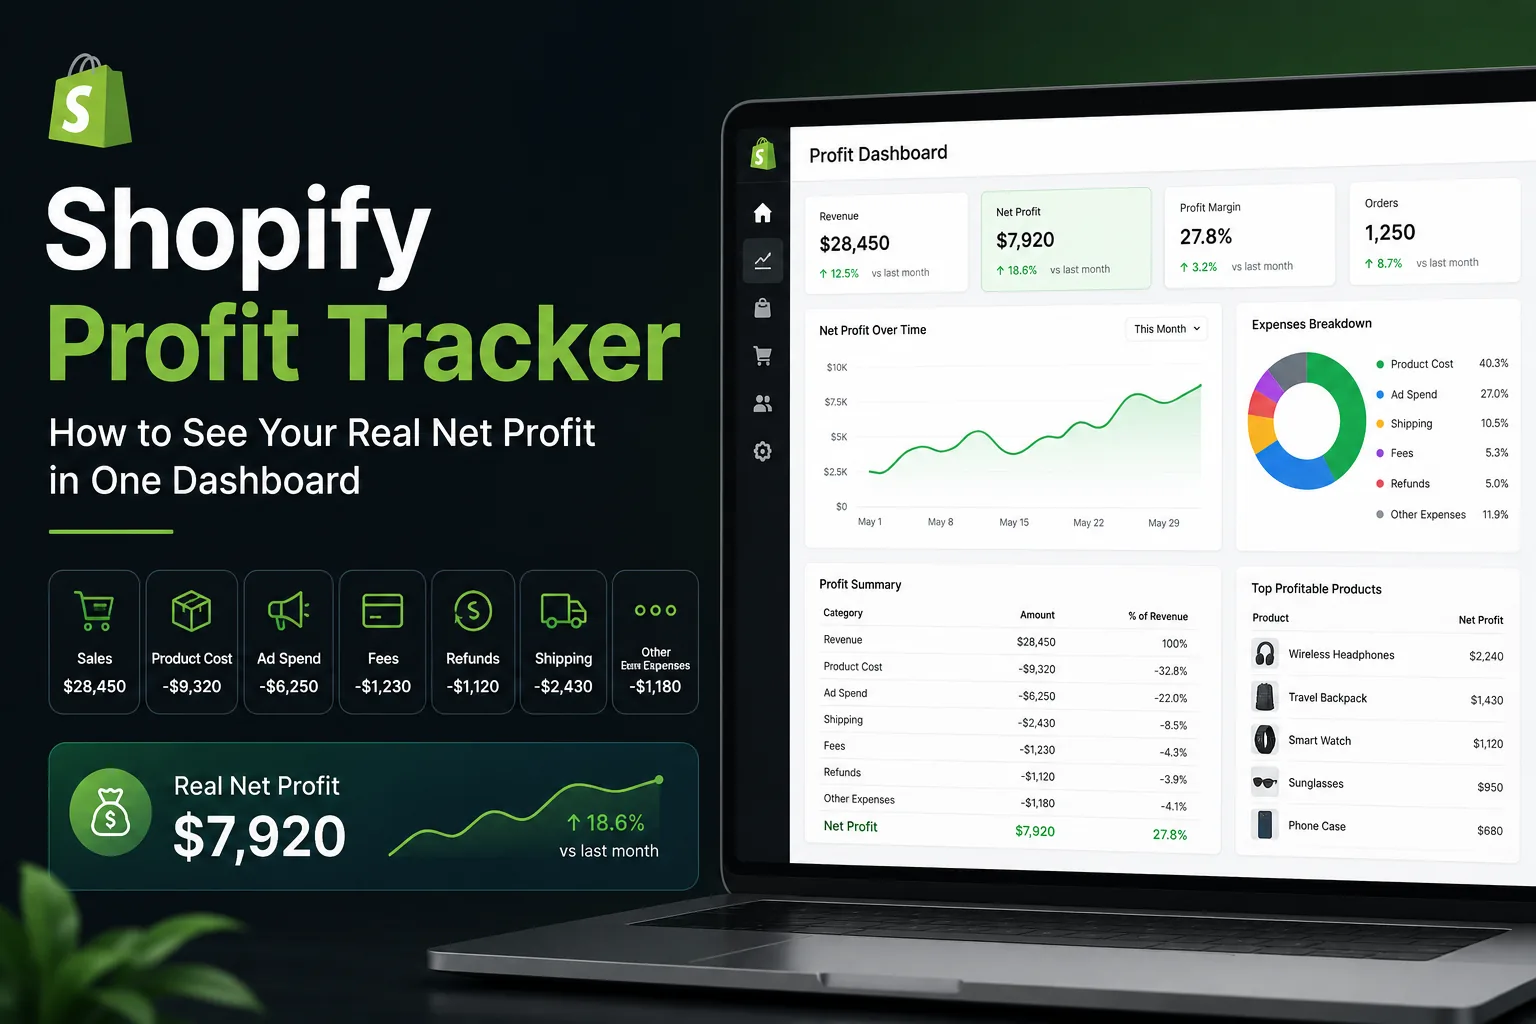
Step 6: Build a Daily Shopify Dashboard
A strong Shopify dashboard should help you make decisions in seconds.
Your daily view should include:
-
Total sales
-
Net sales
-
Orders
-
Average order value
-
Gross profit
-
Net profit
-
Profit margin
-
Ad spend
-
CPA
-
ROAS
-
Refund amount
-
Best-selling products
-
Least profitable products
-
Top sales channels
Keep the top section simple. A store owner should be able to open the dashboard and immediately understand whether the business is improving or slipping.
Then add deeper views for:
-
Product-level profitability
-
Campaign-level profitability
-
Supplier cost changes
-
Order and fulfillment status
-
Refund trends
-
Customer repeat-purchase behavior
-
Store comparisons for multi-brand teams
This is where a dedicated Shopify profit tracker becomes more valuable than disconnected reports. It helps your team move from “What happened?” to “What should we do next?”
Visual direction: Use a Nugglets-style dashboard mockup or approved product screenshot showing profit, sales, ad spend, and product insights.
Alt text: “Shopify profit tracker dashboard with daily sales, costs, ad spend, and net profit.”
Step 7: Validate Your Numbers Every Week
Automation saves time, but you should still review your data.
Set aside a weekly profit review to check:
-
Whether product costs match current supplier pricing
-
Whether ad spend totals match your ad platforms
-
Whether high-refund products need attention
-
Whether payment fees are being captured correctly
-
Whether shipping costs have increased
-
Whether new apps or subscriptions need to be added
-
Whether your best sellers are actually your best profit drivers
Compare Shopify finance reports, payout records, and your tracker. Shopify’s finance reports update frequently, while payouts reflect the movement of funds rather than the same timing as sales activity. (Shopify Help Center)
The goal is not to make every number identical across every system. The goal is to understand why differences exist and use one consistent method for operating decisions.
For tax, bookkeeping, and financial statements, work with a qualified accountant who understands your business structure and location.
Visual direction: Use a weekly ecommerce profit-review checklist graphic.
Alt text: “Weekly Shopify profit tracking checklist for store owners.”
The Best Reporting Rhythm for Shopify Store Owners
Your dashboard should support a daily, weekly, and monthly review cycle.
Daily review
Check sales, ad spend, net profit, refund activity, and major changes in performance.
Use this review to pause obvious loss-making campaigns, investigate unusual refund spikes, and identify products that need attention.
Weekly review
Review margins by product, channel, supplier, and campaign.
This is the right time to update supplier costs, assess creative performance, and decide which products deserve more inventory, testing, or marketing budget.
Monthly review
Review overall profitability, fixed operating costs, customer acquisition trends, return rates, and cash flow.
Use this review to make larger decisions, such as changing suppliers, adjusting pricing, expanding to a new market, or consolidating underperforming apps.
Common Shopify Profit Tracking Mistakes
Avoid these mistakes when setting up your system:
Tracking revenue instead of profit
Revenue is useful, but it does not reveal whether your store is healthy.
Forgetting ad spend
Paid acquisition costs can make a product unprofitable even when it sells well.
Using outdated supplier costs
A product’s margin can disappear after a supplier price increase.
Ignoring refunds and chargebacks
Refunds are not just lost revenue. They can also include fulfillment, replacement, and payment-processing costs.
Treating payouts as profit
Money arriving in your bank account is not automatically net profit. Shopify notes that payout reconciliation reflects balance activity and payout timing, which can differ from sales and payment reports. (Shopify Help Center)
Looking only at store-wide averages
A profitable store can contain unprofitable products, channels, and campaigns. Review profitability at a detailed level.
When to Upgrade to a Dedicated Shopify Profit Tracker
Manual tracking is useful at the beginning, but it becomes harder to manage as your store grows.
Consider moving to a dedicated Shopify profit tracker when you:
-
Run paid campaigns across multiple channels
-
Manage more than a few products or variants
-
Work with multiple suppliers
-
Need faster profit reporting
-
Operate more than one Shopify store
-
Want product-level and order-level margin visibility
-
Spend too much time reconciling spreadsheets
-
Need a clearer Shopify dashboard for your team
For dropshipping businesses, an automated dropshipping profit tracker can also support stronger supplier decisions, faster product testing, and more disciplined ad scaling.
Final Thoughts
Setting up a Shopify profit tracker is one of the highest-impact improvements you can make to your ecommerce operations.
It helps you stop guessing based on sales notifications and start managing based on real numbers. When you track COGS, fees, shipping, refunds, ad spend, and supplier costs in one place, you can see what is driving profit and what is quietly draining it.
Build your dashboard around the metrics that matter most:
-
Net sales
-
Product costs
-
Ad spend
-
Fees
-
Refunds
-
Net profit
-
Profit margin
-
Product and campaign performance
The result is a clearer, more scalable Shopify business.
Run your whole store from one dashboard
Track orders, suppliers, inventory and real profit with Nugglets.
See NuggletsKeep reading
Shopify Revenue vs Profit: Why Your Sales Number Can Mislead You

Comments 0