How to Calculate Your Break-Even ROAS for Shopify
 Brian @brian
·
·
9 min read
5 views
Brian @brian
·
·
9 min read
5 views

A strong ROAS can look impressive in Meta Ads or Google Ads, but revenue is not profit.
A Shopify store can generate a 3.0 ROAS, $3 in tracked revenue for every $1 in ad spend, and still lose money once product cost, shipping, payment fees, discounts, refunds, and fulfillment are included.
That is why every store owner needs to know their break-even ROAS.
Break-even ROAS tells you the minimum return on ad spend required to cover your variable costs. Any ROAS below that number loses money. Any ROAS above it creates room for profit, fixed expenses, and growth.
What Is Break-Even ROAS?
ROAS stands for return on ad spend:
ROAS = Revenue Attributed to Ads ÷ Ad Spend
For example, if you spend $100 on ads and generate $400 in tracked sales:
ROAS = $400 ÷ $100 = 4.0
That means you generated $4 in revenue for every $1 spent on ads.
Your break-even ROAS is different. It answers this question:
“How much revenue do I need from ads before my store stops losing money on each sale?”
The lower your contribution margin, the higher your break-even ROAS.
For example:
-
A product with high margins may break even at a 1.8 ROAS.
-
A low-margin dropshipping product may need a 3.5 ROAS or higher.
-
A product with heavy refunds, discounts, and expensive shipping may need an even higher target.
Meta may describe a 1.0 ROAS as spending $100 to generate approximately $100 in tracked purchase value. That is ad-platform break-even only, not true business break-even. Your store still has product, payment, fulfillment, and refund costs to cover. (Facebook)
The Break-Even ROAS Formula
The simplest formula is:
Break-Even ROAS = Net Revenue ÷ Contribution Profit Before Ads
Or, expressed as a margin:
Break-Even ROAS = 1 ÷ Contribution Margin
Your contribution margin is the amount left from each sale after variable costs, before advertising and fixed overhead.
Contribution Profit Before Ads =
Net Revenue
− Product Cost
− Shipping and Fulfillment
− Payment Fees
− Refund Allowance
− Variable App or Transaction Costs

Example Formula
Imagine your Shopify store sells a product for $60. After discounts, your average net revenue per order is $55.
| Cost item | Amount |
|---|---|
| Net sales per order | $55.00 |
| Product cost | -$18.00 |
| Shipping and fulfillment | -$6.50 |
| Payment processing fees | -$1.90 |
| Refund and chargeback allowance | -$3.00 |
| Variable tools and transaction costs | -$0.60 |
| Contribution profit before ads | $25.00 |
Your break-even ROAS would be:
$55 ÷ $25 = 2.2 break-even ROAS
At a 2.2 ROAS, you are not making profit from that customer. You are simply covering your variable costs and ad spend.
A 3.0 ROAS would give you more room. A 1.8 ROAS would mean you are likely losing money on each paid order.
Which Costs Should You Include?
The most common break-even ROAS mistake is only using product cost.
A Shopify store’s true profitability depends on much more than cost of goods sold.

Include These Variable Costs
Product cost or COGS
Include the supplier price, manufacturing cost, packaging, and any per-order sourcing fees.
Shipping and fulfillment
Include supplier shipping, fulfillment charges, pick-and-pack fees, warehouse costs tied to individual orders, and shipping label costs.
Payment processing fees
Shopify Payments, PayPal, Klarna, Shop Pay, and other processors may charge transaction fees that reduce profit on every sale.
Discounts
Your reported revenue should reflect actual revenue after discounts. A product sold for $60 with a 20% discount is not a $60 sale for profitability purposes.
Refunds and chargebacks
Use a reserve based on your recent refund rate. For example, a store with a 5% refund rate should not calculate break-even ROAS as though every order is final.
Variable software costs
Include per-order transaction charges, cash-on-delivery verification fees, post-purchase upsell fees, affiliate commissions, and fulfillment software charges where relevant.
Costs to Treat Separately
Fixed expenses are still important, but they should usually be reviewed after calculating per-order break-even ROAS.
Examples include:
-
Salaries
-
Agency retainers
-
Monthly software subscriptions
-
Office costs
-
Creative production
-
Accounting and legal fees
For more complete planning, calculate two thresholds:
-
Contribution break-even ROAS, which covers costs directly tied to each sale.
-
Operating break-even ROAS, which also includes an allocated share of monthly overhead.
This prevents you from scaling ad spend based on a campaign that looks profitable per order but cannot cover the store’s total operating costs.
How to Calculate Break-Even ROAS in Shopify
Shopify has analytics, sales reports, finance reports, and profit reports that can help you collect the numbers needed for the calculation. Shopify’s profit reports can show product costs, margins, and profit data when product cost information is maintained in your store. (Shopify Help Center)

Step 1: Find Your Net Sales
Use Shopify sales reports to identify revenue after discounts, returns, and other adjustments where applicable.
Use a date range that represents normal performance. Seven days may be enough for a fast-moving store, but 30 to 90 days often produces a more reliable benchmark.
Shopify’s finance reports can help track financial information including sales and payments. (Shopify Help Center)
Step 2: Update Product Costs
In Shopify, make sure each product or variant has an accurate “cost per item” value.
Incorrect COGS will create misleading profit reports and cause your break-even ROAS target to be too low.
For dropshipping stores, refresh supplier costs when suppliers change prices, shipping rates, packaging requirements, or fulfillment methods.
Step 3: Add Fulfillment, Fees, and Refund Reserves
Shopify will not automatically know every fulfillment cost, supplier shipping cost, chargeback loss, or ad-specific expense.
Add these manually to a spreadsheet or track them through a Shopify profit tracker that combines order data with cost and marketing data.
A useful refund reserve formula is:
Refund Reserve Per Order =
Average Net Revenue Per Order × Refund Rate
For example:
$55 average net revenue × 5% refund rate = $2.75 refund reserve
Step 4: Calculate Contribution Profit
Contribution Profit =
Net Revenue − All Variable Non-Ad Costs
This is your maximum available budget for acquiring one order while still breaking even.
Step 5: Calculate Break-Even ROAS
Break-Even ROAS = Net Revenue ÷ Contribution Profit
Use the same revenue definition your ad platform uses whenever possible. For example, if Meta is optimizing against purchase event value, compare that tracked purchase value against your Shopify net revenue model consistently.
A Full Shopify Break-Even ROAS Example
Let’s use a realistic dropshipping example.

A Shopify store sells a portable blender.
| Metric | Amount |
|---|---|
| Product selling price | $64.99 |
| Average discount | -$4.99 |
| Net revenue per order | $60.00 |
| Supplier product cost | -$21.00 |
| Supplier shipping cost | -$7.00 |
| Payment fees | -$2.10 |
| Fulfillment and order costs | -$1.50 |
| Refund reserve | -$3.00 |
| Contribution profit before ads | $25.40 |
Now calculate break-even ROAS:
Break-Even ROAS = $60.00 ÷ $25.40
Break-Even ROAS = 2.36
This store needs at least a 2.36 ROAS to break even on paid acquisition.
That does not mean the campaign should be scaled at 2.36.
A smarter target includes profit.
Calculate Your Target ROAS
Assume the store wants at least $9 in net profit per order after advertising.
Maximum Ad Spend = Contribution Profit − Desired Net Profit
$25.40 − $9.00 = $16.40 maximum ad spend
Then:
Target ROAS = Net Revenue ÷ Maximum Ad Spend
$60.00 ÷ $16.40 = 3.66 target ROAS
The practical targets become:
| ROAS level | What it means |
|---|---|
| Below 2.36 | Losing money on paid orders |
| 2.36 | Break-even before fixed overhead |
| 2.5 to 3.4 | Small contribution profit |
| 3.66+ | Meets the desired $9 profit target |
Why One Store Needs Multiple Break-Even ROAS Targets
A single account-wide target can hide unprofitable products.
Your break-even ROAS can change based on:
-
Product cost
-
Selling price
-
Bundle size
-
Shipping destination
-
Discount level
-
Refund rate
-
Payment method
-
Supplier cost changes
-
Returning versus first-time customers
-
Campaign type and attribution window
A $25 product with slim margins may need a 4.0 ROAS. A $150 bundle with stronger margins may be profitable at a 2.0 ROAS.
That is why a dropshipping dashboard should show product-level profitability, not just total ad revenue.
Shopify also notes that results can differ between Shopify Analytics and third-party tracking tools, including Google Analytics. Review discrepancies before making major budget decisions. (Shopify Help Center)
Build a Break-Even ROAS Calculator
A simple spreadsheet can give you a useful starting point.

Create these columns:
| Column | Formula or data source |
|---|---|
| Product or campaign | Product name, SKU, or campaign |
| Net revenue per order | Selling price less discounts and refunds |
| COGS | Supplier or product cost |
| Shipping and fulfillment | Supplier shipping and fulfillment fees |
| Payment fees | Average processing cost |
| Refund reserve | Net revenue × refund rate |
| Variable costs | Apps, commissions, transaction charges |
| Contribution profit | Net revenue less all variable costs |
| Break-even ROAS | Net revenue ÷ contribution profit |
| Target ROAS | Net revenue ÷ desired ad-spend limit |
Review the calculator every month, or more often if supplier prices and shipping rates move frequently.
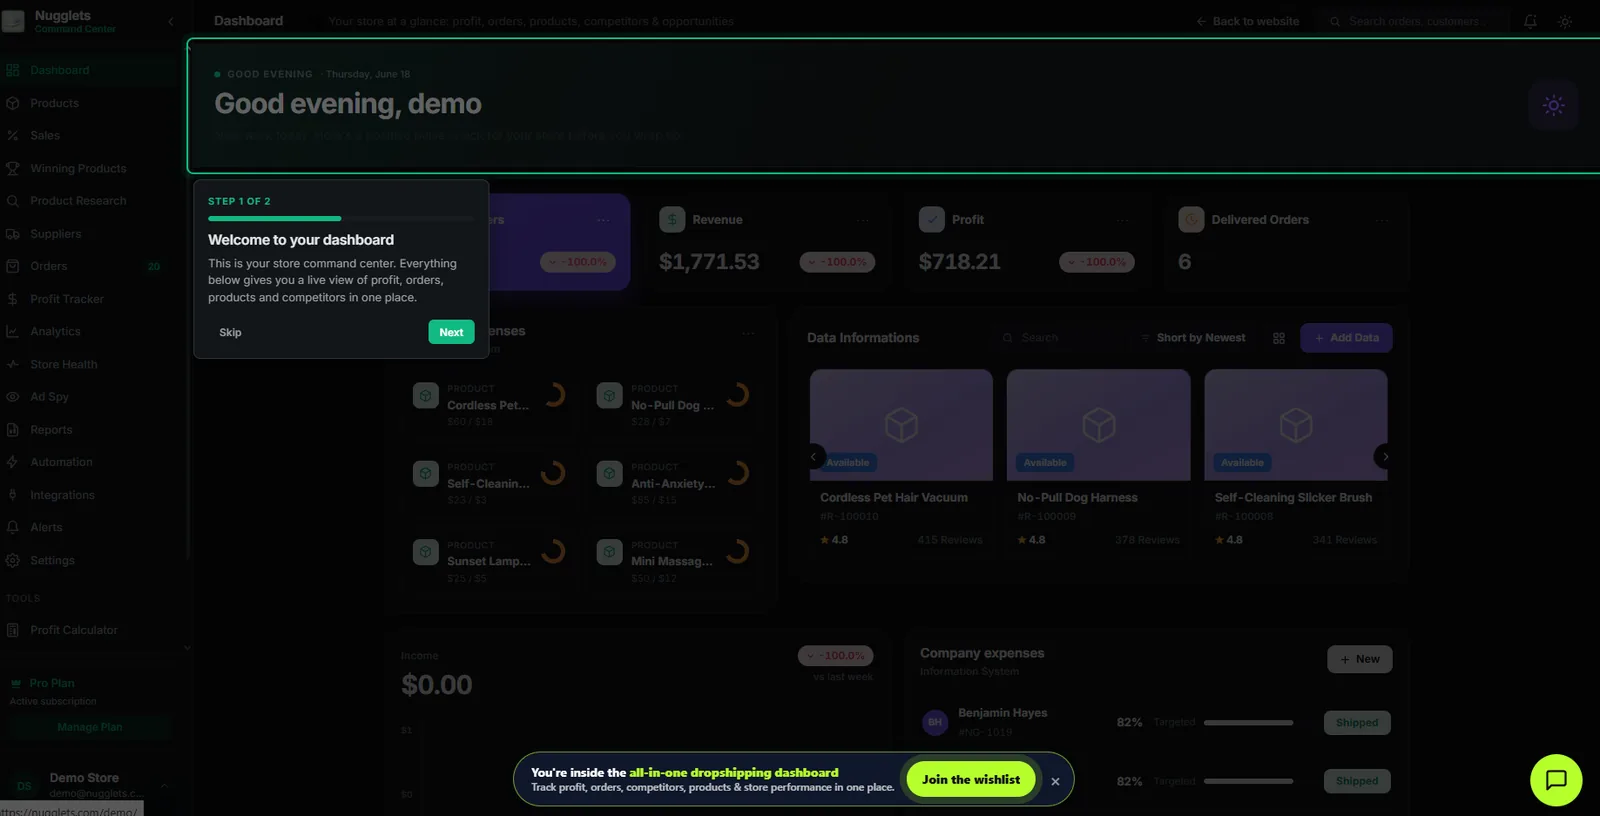
For stores with a large catalog, a shopify dashboard is more useful than a spreadsheet because it can centralize orders, COGS, ad spend, refunds, fees, and product performance in one view.
Google Analytics can support ecommerce reporting, but ecommerce interactions such as product views, add-to-carts, and purchases must be properly implemented to be measured. (Google Help)
Common Break-Even ROAS Mistakes
Using Revenue Instead of Net Revenue
Gross sales can exaggerate profitability. Account for discounts, refunds, and other revenue reductions.
Forgetting Transaction Fees
Payment processing costs may appear small per order, but they add up quickly at scale.
Ignoring Refunds
A campaign can look profitable before refunds and become unprofitable after return requests arrive.
Shopify distinguishes returns and refunds in reporting, so review both carefully when building your model. (Shopify Help Center)
Treating Platform ROAS as Profit
Meta, Google, TikTok, and other platforms report attributed revenue, not your final net profit.
Use platform ROAS for campaign optimization. Use a shopify profit tracker for actual business decisions.
Using the Same Target for Every Product
Different products have different margins. Track break-even ROAS by product, collection, bundle, and campaign where possible.
Turn Break-Even ROAS Into a Daily Decision-Making System
Break-even ROAS is most useful when it becomes part of your daily ecommerce workflow.
Use it to decide:
-
Which campaigns deserve more budget
-
Which products need a price increase
-
Which suppliers are reducing your margin
-
Which bundles improve profitability
-
Which discounts are too aggressive
-
Which products should be paused
-
Which ads create profitable new-customer acquisition
A real-time ecommerce profit tracker should help you see more than revenue. It should show whether each sale is profitable after COGS, fees, advertising, fulfillment, shipping, and refunds.
That is the difference between a store that appears to be scaling and a store that is actually generating profit.
Final Takeaway
Your break-even ROAS is not a universal benchmark. It is a profitability threshold based on your Shopify store’s real costs.
Calculate it using net revenue, COGS, shipping, fees, refunds, and variable order costs. Then set a higher target ROAS that leaves room for profit.
The formula is simple:
Break-Even ROAS = Net Revenue ÷ Contribution Profit Before Ads
Once you know that number, you can scale ads with more confidence, spot unprofitable products faster, and use your Shopify dashboard to focus on the metric that matters most: actual profit.
Run your whole store from one dashboard
Track orders, suppliers, inventory and real profit with Nugglets.
See Nugglets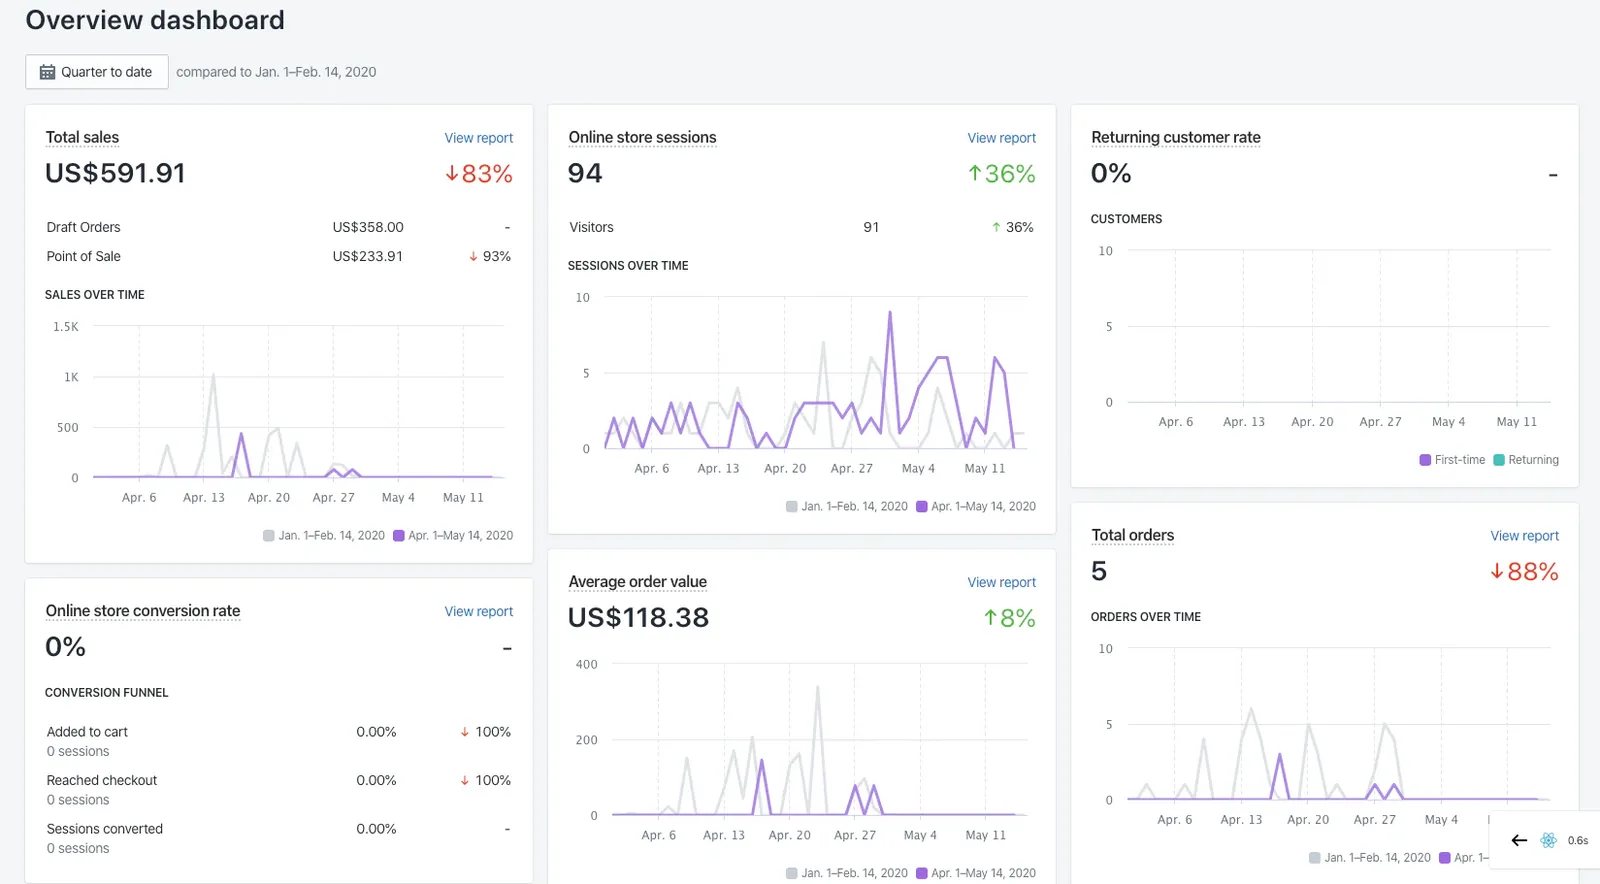

Comments 0